Introduction
Is article me main meesho ka monthly-term technical analysis ke chart ko bilkul basic tareeke se samjhenge. Yahan koi buy ya sell tip nahi di ja rahi ye analysis ka purpose purely educational hai Yaha hum market structure, candlestick pattern, support–resistance zone, chart pattern jaise (M&W Pattern) ke base par chart kya bol raha hai uska analysis kiya ja raha hai.
Meesho Limited Market Structure Analysis
Jab main Monthly Chart ko analysis kiya to mujhe market ka structure unclear/weak jaisa lag raha uske piche simple reason hai ye meesho ka share abhi recently listed hua hai .
Lekin chart dekh kar kuch chize pta lagi-
- Jaise listing hone ke baad strong volatility dikhi.
- Upper level par heavy seeling pressure aaya.
- Dekhne se saaf lag raha buyer-seller ke bich fight ho rahi abhi .
- February me meesho share ka agar achha financial result aayega usse ho sakta hai monthly me achha move dekhne ko mile.
Support and Resistance Levels
Important support zone in monthly frame
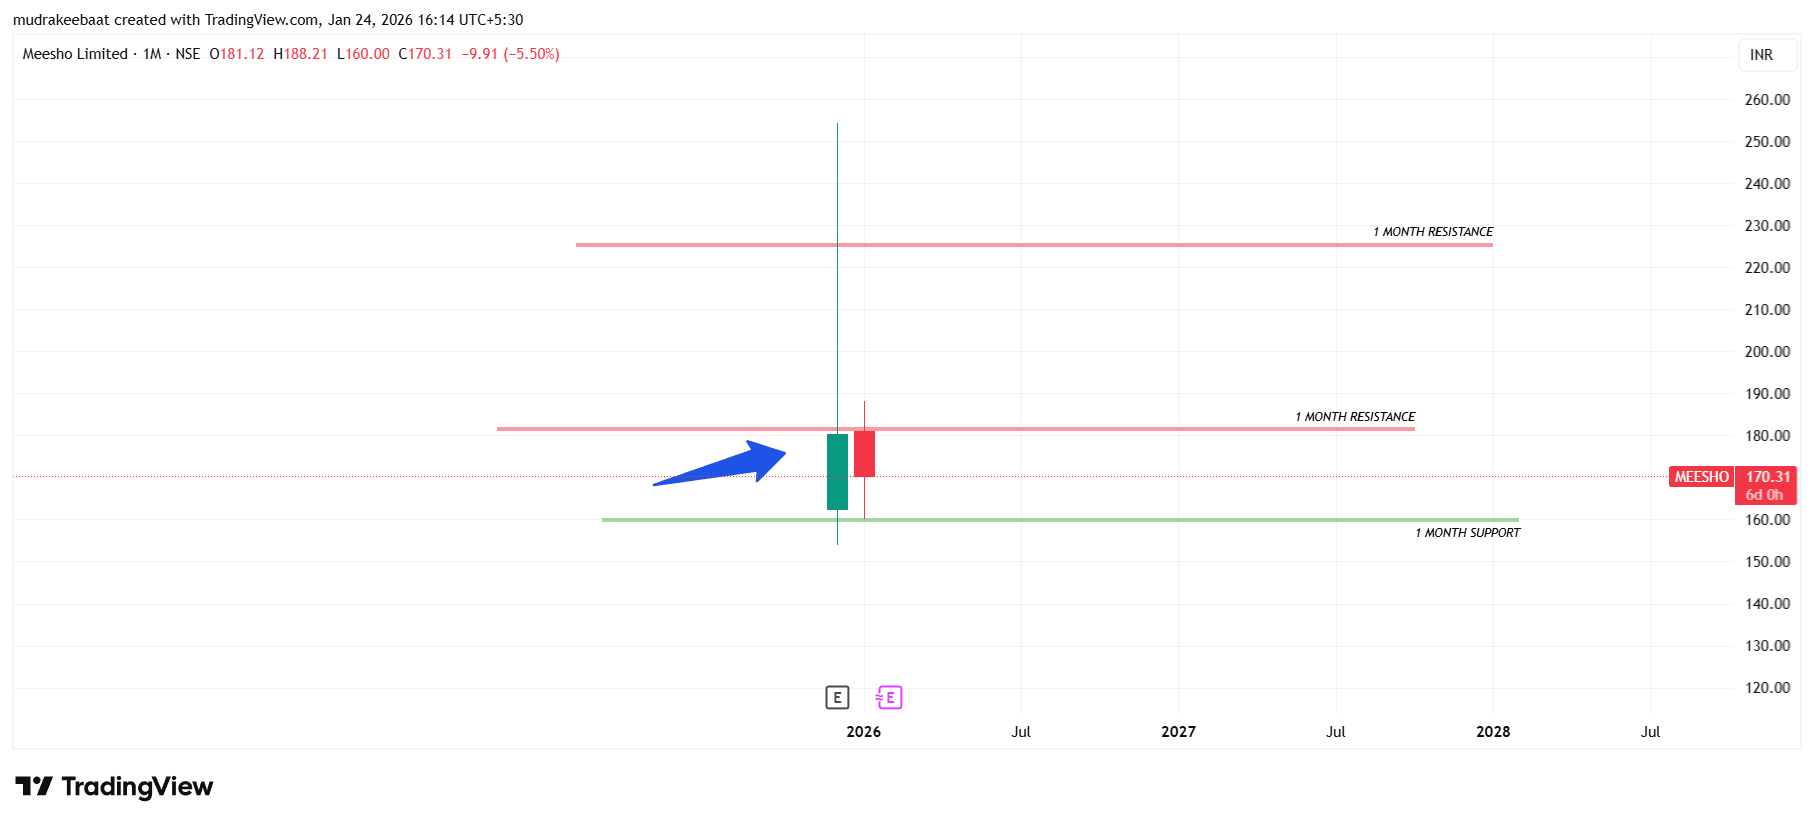
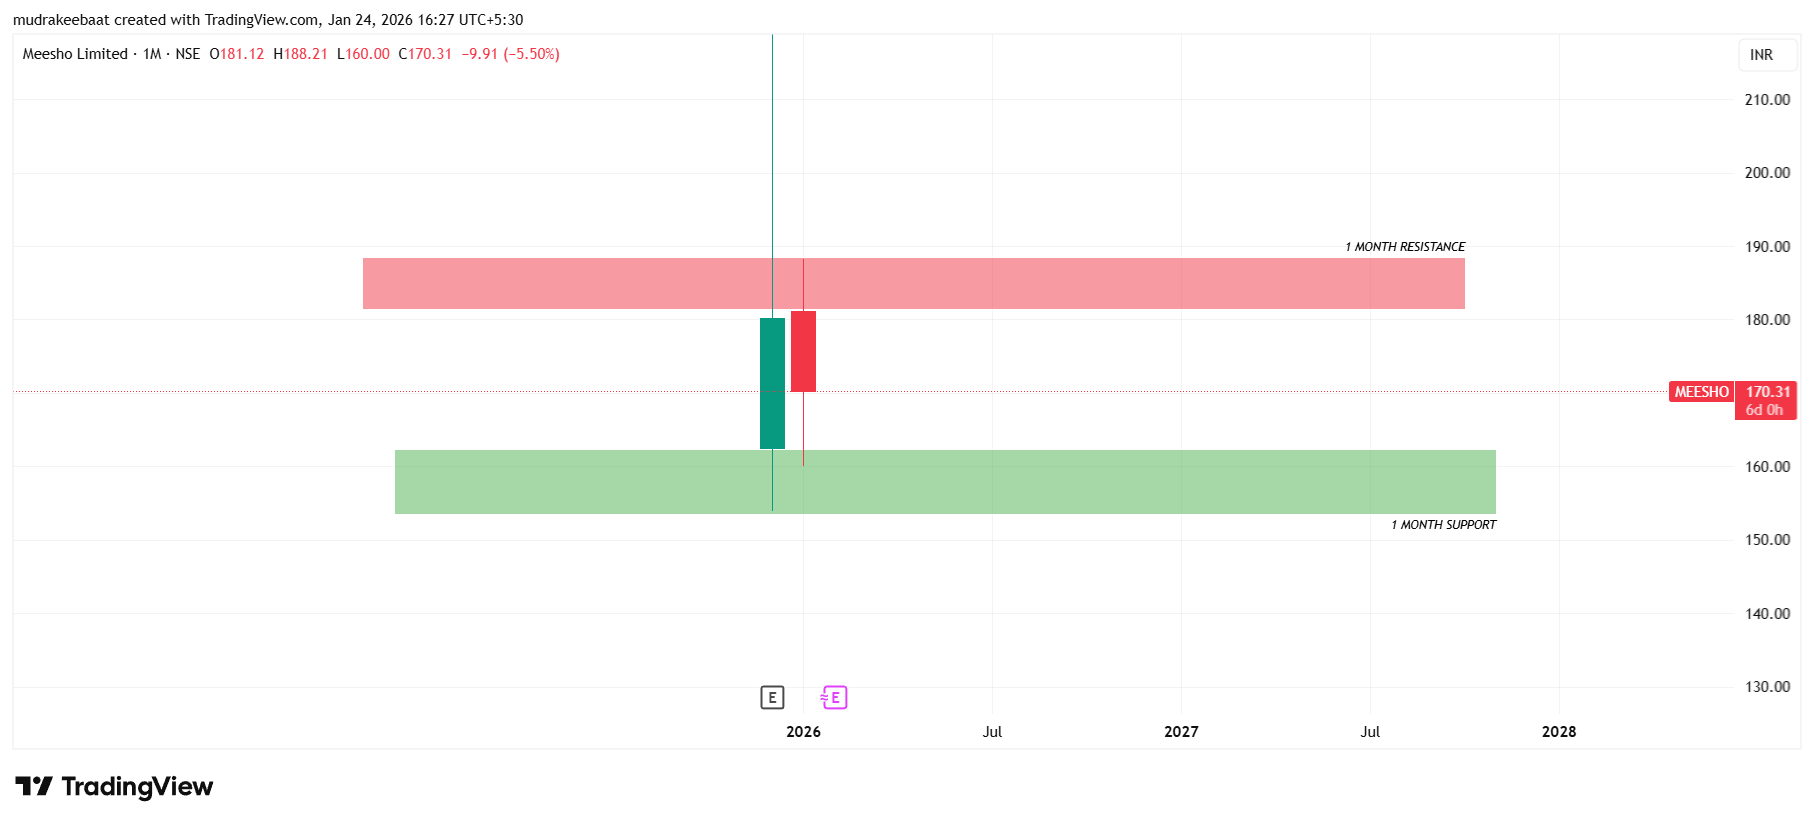
160 – 165 Ye Green wala zone sabse first support zone ( Buyer ka ghar ) ke roop me kaam kar raha hai , agar is level ke niche price aata hai montly time frame me to weakness shayad ho sakti hai.
185 – 200 Ye Red wala zone supply area matlab seller ka ghar bolege, agar price yis zone se uper candle closing karta hai to tezzi dekhne ko mile sakta hai shayad aur buyer active hone ke possibility hai .
Candlestick Analysis
Candlestick analysis me main candlestick ka behavior dekhuga matlab monthly time me jo 2 candle bna hai uska shape- size kaisa hai .
- Jab main dekha to mujhe samaj aaya ki first candle pin candle hai jo uper se bahut selling pressure aaya hai, Upper se long wick bnaya hai .
- Phir main dekha second candle bhi red candle hai jo selling ka pressure show karti hai .
- Abhi bhi yis month ko 6 din aur hai dekhte hai market me kya hota hai , agar buyer active hue to yis month ka candle ek hammer candle bna dega jo meesho share ke liye shayad postive signal ho.
Chart Pattern Analysis
Abhi jaisa main aap log ko btaya hu ki ye share ki listing abhi hui hai isliye koi clear chart pattern ka formation nhi hua hai ( Jaise cup& handle pattern, triangle pattern etc).
Conclusion ( Final Kya Samjha Jaye )
Guys, Meesho limited ka long term chart jab main dekha to mujhe high risk zone me laga kyu-
- Monthly chart me abhi koi trend clear nhi hai .
- Strong selling pressure dekhne ko mila kyuki upper side bade wick dikhe.
- Agar aap long term investor hai to abhi wait & watch better strategy hogi shayad aap log ke liye.
- Jab tak koi structure clear nhi hota tab tak jaldbazzi karna galat decision ho sakta hai mere khayal se.
Link – TradingView Chart Analysis
Disclaimer
Yeh analysis sirf educational aur informational purpose ke liye hai. Main SEBI registered advisor nahi hoon. Stock market mein risk hota hai aur past price behaviour future results ki guarantee nahi deta. Koi bhi decision lene se pehle apne financial advisor se salah lena zaruri hai. Yeh content beginner education ke liye banaya gaya hai.