Table of Contents
ToggleIntroduction
Is article me hum Meesho Technical Analysis for Intraday 17 February 2026 ko simple price action ke through samjhenge . Aaj trading session me meesho share ka price ₹154.25 par close hua. Aaj Price ne strating me red candle ke sath opening hua lekin uske baad strong recovery dikhayi, uske baad poora din session mostly sideways consolidiation me raha overall , market thik raha aur selling pressure zyada strong nhi dikha.
Sabse Pahle ek intraday traders ko 1-day-1-hour- 5-minutes tino time frame me kya dekhna chahiye? Nhi pta chaliye chalte hai sab time frame me dekhe aur samjhe chart humse kya bolna chah raha – Chaliye ab har time frame me dekhte hain ki chart hume kya signal dena chah raha hai jisse hum kal 17 February 2026 intraday trading kar sake.
Meesho Technical Analysis For Intraday – 1 Day Time Frame
Overall Trend –
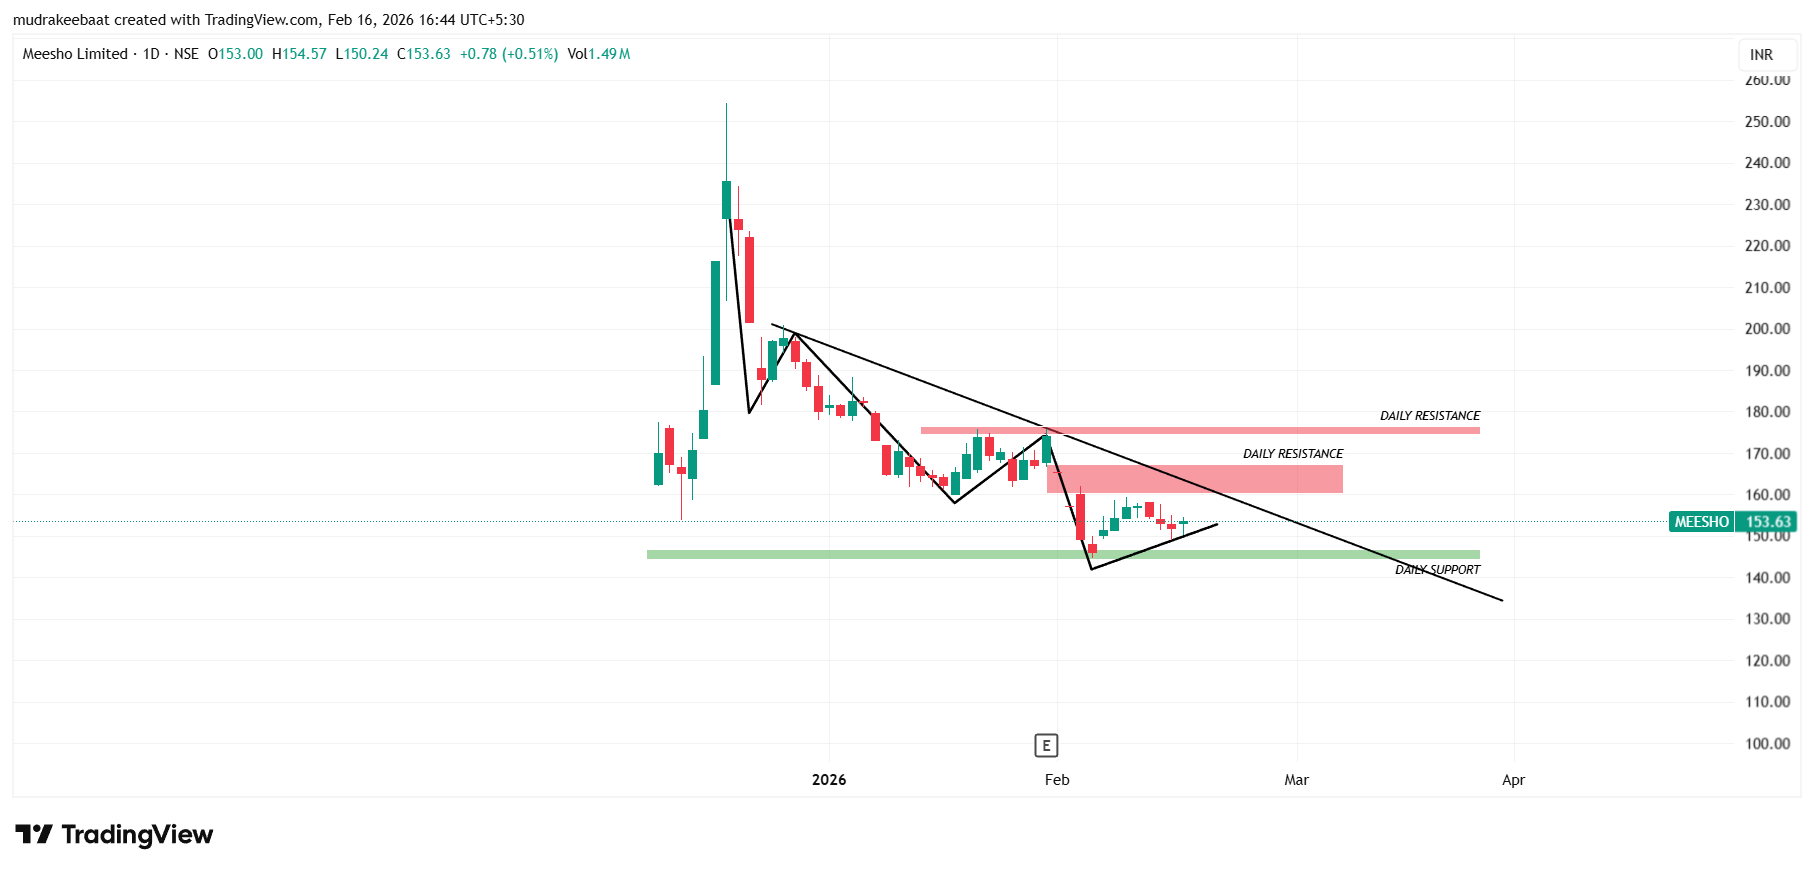
- Chart dekhne par sabse pehle clear hota hai ki price pehle ek strong downtrend me tha, jahan lagataar lower high aur lower low ban rahe the — yani sellers full control me the.
- Lower zone ke aas-paas price ek sideways base / consolidation structure banata hua dikh raha hai, jisse pata chalta hai ki yahan buyers interest lena shuru kar rahe hain.
- Overall daily trend ko dekhen to market abhi downtrend se stabilization phase me shift ho raha hai — yani next move decide hone se pehle balance ban raha hai
Important Support & Resistance Zones –
Next trading session me ye point me dhyan rakhna chahiye agar aap trade karne ko soch rahe ho.
| Zone Type | Price Area ( Approx ) |
| Support Zone 1 | ₹144-145 |
| Resistance Zone 1 | ₹165 |
| Resistance Zone 2 | ₹174 |
Meesho Technical Analysis For Intraday – 1 Hour Time Frame
Overall Trend –
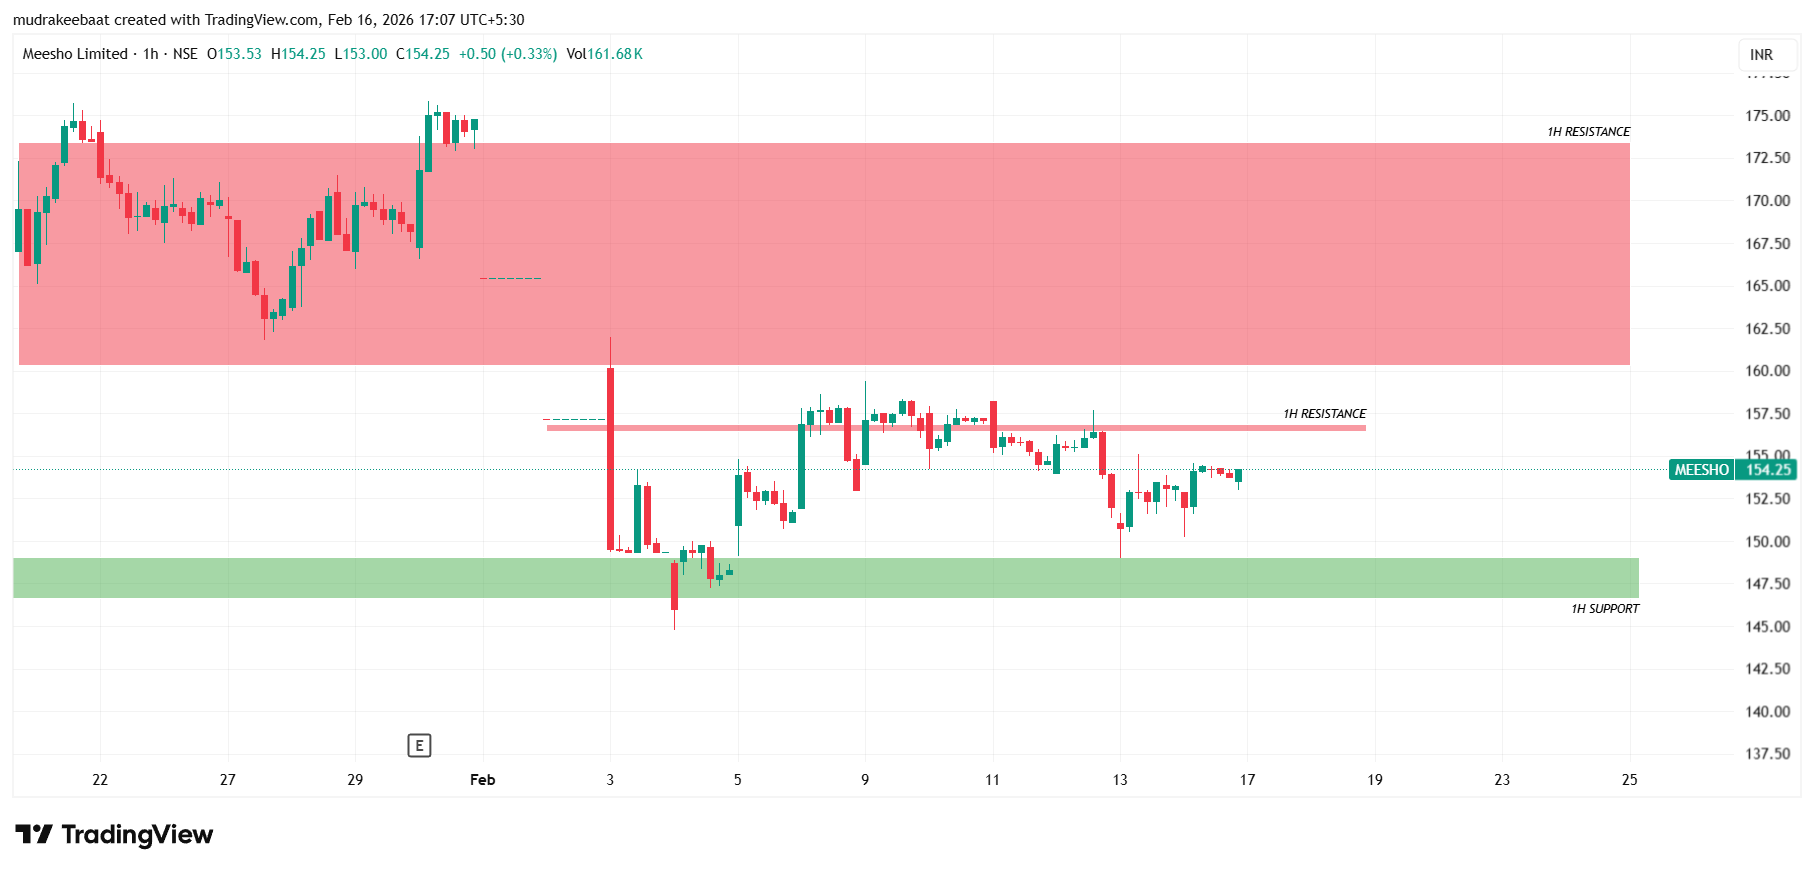
- 1- hour chart me overall trend downtrend dikh raha jisme lower-low aur lower high bna raha jo bta raha abhi seller control me hai.
- Uske Baad price chhoti range ke andar swing karta dikh raha hai, jahan upar jaate hi resistance aa rahi hai aur neeche aate hi support mil raha.
Important Support & Resistance Zones –
Next trading session me ye point me dhyan rakhna chahiye agar aap trade karne ko soch rahe ho.
| Zone Type | Price Area ( Approx ) |
| Support Zone 1 | ₹148-146 |
| Resistance Zone 1 | ₹160-175 |
| Resistance Zone 2 | ₹156 |
Download Image- TradingView
Meesho Technical Analysis For Intraday – 5 Minute Time Frame
Overall Trend –
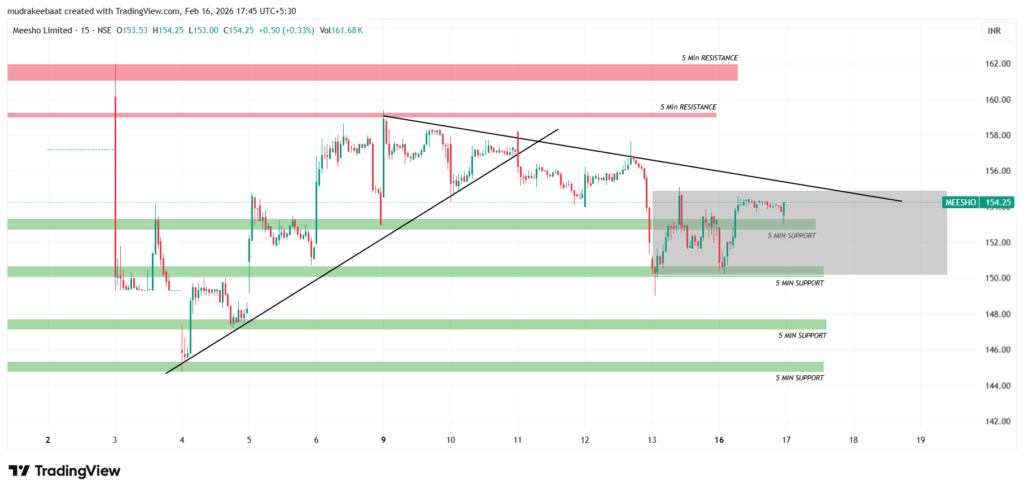
- Price top zone tak pahunchne ke baad niche correct hua, lekin previous uptrend ka last swing low break nhi hua. Isi wajah se proper downtrend formation confirm nhi hota, warna structure lower high- lower low me shift ho jata.
- Latest Price action dekhen to abhi tak price na last swing high break kar pa raha hai aur na swing low, isliye market filhaal ek tight consolidation zone me ruk kar next direction decide karne ki koshish kar raha hai
Important Support & Resistance Zones –
Next trading session me ye point me dhyan rakhna chahiye agar aap trade karne ko soch rahe ho.
| Zone Type | Price Area ( Approx ) |
| Support Zone 1 | ₹153 |
| Support Zone 2 | ₹150 |
| Resistance Zone 1 | ₹159 |
| Resistance Zone 2 | ₹162 |
Download Image- TradingView
Agar aap Meesho share ke bare me aur detail me padhna chahte hain, to yahan study kar sakte hain:
Meesho Share Detailed Study Link
Disclaimer
Yeh analysis sirf educational aur informational purpose ke liye hai. Main SEBI registered advisor nahi hoon. Stock market mein risk hota hai aur past price behaviour future results ki guarantee nahi deta. Koi bhi decision lene se pehle apne financial advisor se salah lena zaruri hai. Yeh content beginner education ke liye banaya gaya hai.