

Bitcoin is trading around $63,536 on the 1-hour chart. BTC is holding near the $63,400 support zone, while $64,300 is the first major resistance. The larger resistance remains at $65,200–$65,400.The 1-hour RSI is 48.34, showing neutral-to-weak momentum. Bitcoin is also slightly below the middle Bollinger Band at $63,574, so the short-term structure remains cautious.For today, the main focus is the U.S. PPI report, Initial Jobless Claims and Federal Reserve speakers. Tomorrow, the key U.S. events are Retail Sales, University of Michigan Consumer Sentiment and Business Inventories.
Table of Contents
ToggleBitcoin Market Structure for 1 Hour
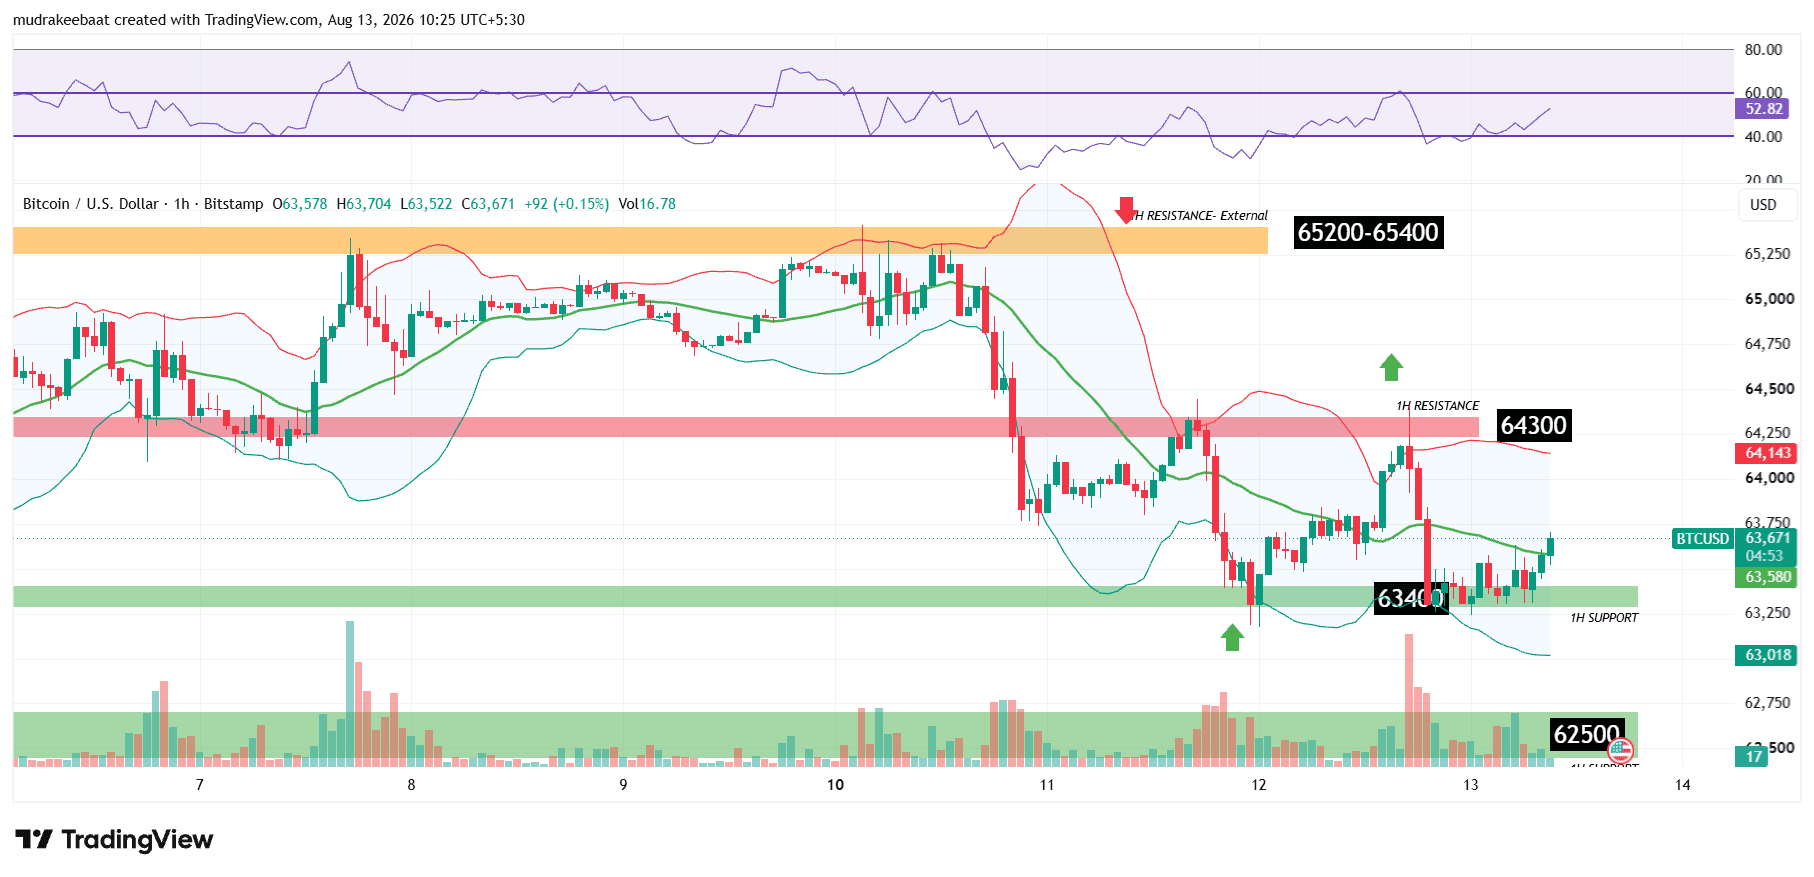
Bitcoin is still recovering from the sharp decline that started from the $65,200–$65,400 resistance zone.After the decline, BTC reached the $63,400 support area and has spent the recent candles consolidating around this level. Buyers have managed to defend the support, but the recovery remains limited because Bitcoin has not yet broken the $64,300 resistance.The current structure is therefore still cautious. Bitcoin needs to reclaim the resistance levels before the short-term trend can become clearly bullish.
| Price Level | Importance |
|---|---|
| $65,200–$65,400 | Major external resistance |
| $64,300 | 1H resistance |
| $63,574 | Bollinger middle band |
| $63,400 | 1H support |
| $63,012 | Bollinger lower band |
| $62,500 | Major support |
Bitcoin Support Levels
$63,400 Support
The $63,400 area is the most important immediate support on the current chart.Bitcoin has been moving around this area for several candles, showing that buyers are attempting to defend the level.If BTC continues to hold above $63,400, the price could again attempt a recovery toward $64,300.If Bitcoin breaks below $63,400 with strong selling pressure, the next major support on the chart is around $62,500.
$62,500 Support
The $62,500 area is the next major support visible on the chart.This level becomes important if $63,400 fails. A move toward $62,500 would indicate that the current consolidation has developed into a deeper correction.
Bitcoin Resistance Levels
$64,300 Resistance
The $64,300 area is the first major resistance.Bitcoin recently moved toward this area but failed to maintain the recovery. Therefore, $64,300 is an important level for today’s price action.A clean breakout and sustained acceptance above $64,300 could improve the short-term structure.
$65,200–$65,400 Major Resistance
The $65,200–$65,400 zone remains the major external resistance shown on the chart.This area previously attracted strong selling pressure. Therefore, even if BTC breaks $64,300, buyers will still need to overcome this higher resistance zone.A sustained move above $65,400 would provide stronger bullish confirmation.
Bollinger Bands Analysis for 1 Hour
The current 1-hour Bollinger Band levels shown on the chart are approximately:
| Bollinger Band | Level |
|---|---|
| Upper Band | $64,135 |
| Middle Band | $63,574 |
| Lower Band | $63,012 |
| Current BTC Price | $63,536 |
Bitcoin is currently trading slightly below the middle Bollinger Band at $63,574.If BTC reclaims the middle band, the upper Bollinger Band around $64,135 becomes the next technical area to watch. This is also close to the $64,300 resistance.If Bitcoin moves lower, the lower Bollinger Band near $63,012 could become relevant. However, $62,500 remains the stronger horizontal support shown on the chart.
RSI Analysis for 1 Hour

The current 1-hour RSI is 48.34.The RSI is slightly below the neutral 50 level, which indicates that short-term momentum remains weak. However, it is still well above 30, so Bitcoin is not in an oversold condition.For bullish momentum to strengthen, RSI moving above 50 together with a breakout above $64,300 would provide better confirmation.
If RSI falls below 40 while BTC breaks below $63,400, bearish momentum would become stronger.
| RSI Level | Interpretation |
|---|---|
| Above 60 | Stronger bullish momentum |
| 50–60 | Improving momentum |
| 40–50 | Neutral to weak |
| Below 40 | Increasing bearish momentum |
| Below 30 | Oversold |
Major Bitcoin News and Market Factors
- Bitcoin remains around the $63,000–$64,000 region, with the market still waiting for a stronger catalyst to break the current range. Recent market coverage has described BTC as range-bound near the $63,000 area.
Potential BTC Impact: Neutral. - U.S. spot Bitcoin ETFs recently recorded around $854 million in net inflows over five days, marking one of the strongest weekly inflow periods since April. However, the inflows have not yet produced a decisive breakout above the major resistance zones.
Potential BTC Impact: Mildly positive. - U.S. Treasury auctions are another factor being watched by the market this week. Higher Treasury yields can create pressure on risk assets, including Bitcoin, while stronger demand for Treasuries can have the opposite effect.
Potential BTC Impact: Potentially negative if yields rise sharply. - Today’s U.S. PPI report is the main macro catalyst for Bitcoin. The data can influence expectations for Federal Reserve policy, Treasury yields and the U.S. Dollar.
Potential BTC Impact: High volatility risk.
Major News Impact Summary
| News/Event | Potential BTC Impact |
|---|---|
| Bitcoin remains range-bound | Neutral |
| Recent ETF inflows | Mildly positive |
| Treasury yields and auctions | Potentially negative if yields rise |
| U.S. PPI today | High volatility |
| Federal Reserve speakers today | Moderate volatility |
U.S. Economic Events for Today — August 13
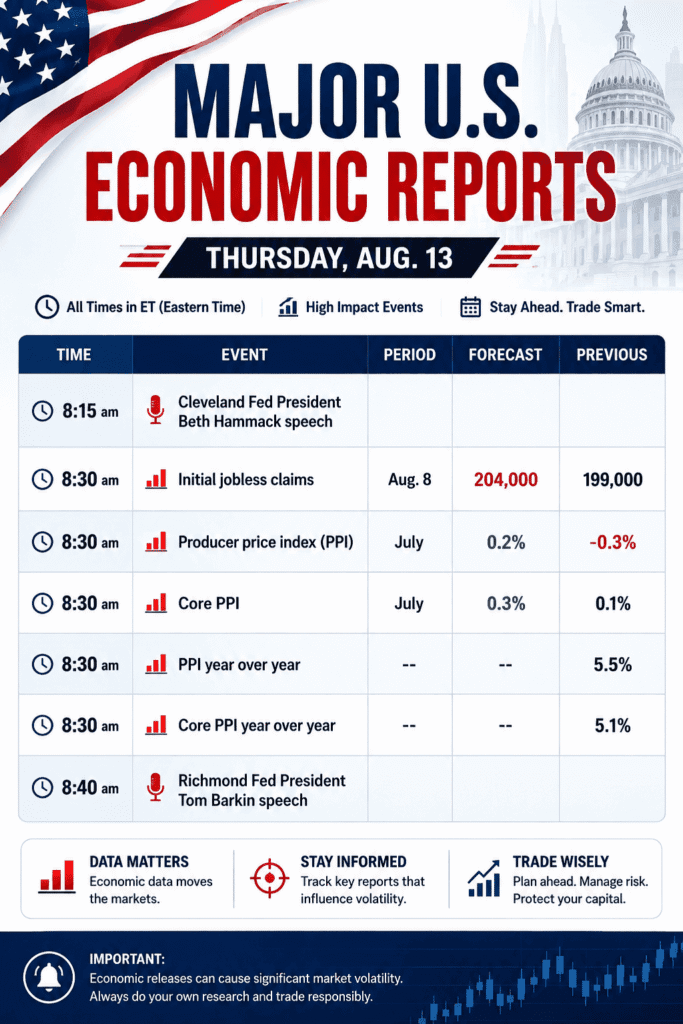
Today’s most important U.S. economic events are concentrated around the 8:30 AM ET data release. For India, 8:30 AM ET is approximately 6:00 PM IST.
| Event | Time ET | Time IST | Forecast | Previous | BTC Impact |
|---|---|---|---|---|---|
| Beth Hammack Speech | 8:15 AM | 5:45 PM | — | — | Moderate |
| Initial Jobless Claims | 8:30 AM | 6:00 PM | 204,000 | 199,000 | Moderate |
| PPI MoM | 8:30 AM | 6:00 PM | 0.2% | -0.3% | High |
| Core PPI MoM | 8:30 AM | 6:00 PM | 0.3% | 0.1% | High |
| PPI YoY | 8:30 AM | 6:00 PM | — | 5.5% | High |
| Core PPI YoY | 8:30 AM | 6:00 PM | — | 5.1% | High |
| Tom Barkin Speech | 8:40 AM | 6:10 PM | — | — | Moderate |
The PPI and Initial Jobless Claims are scheduled for 8:30 AM ET, with Cleveland Fed President Beth Hammack speaking at 8:15 AM ET and Richmond Fed President Tom Barkin at 8:40 AM ET.
If PPI Comes Lower Than Expected
A lower-than-expected PPI could indicate easing producer-level inflation pressure.This could reduce concerns about persistent inflation and potentially support expectations for a less restrictive Federal Reserve policy.
| Asset | Possible Reaction |
|---|---|
| Bitcoin | Potentially positive |
| Gold | Potentially positive |
| U.S. Dollar | Potentially weaker |
| Treasury yields | Potentially lower |
For Bitcoin, a favorable reaction could help BTC move toward $64,300.
If PPI Comes Higher Than Expected
A higher-than-expected PPI could increase concerns about persistent inflation.That could support the U.S. Dollar and Treasury yields while putting pressure on risk assets such as Bitcoin.
| Asset | Possible Reaction |
|---|---|
| Bitcoin | Potentially negative |
| Gold | Potentially negative |
| U.S. Dollar | Potentially stronger |
| Treasury yields | Potentially higher |
In this scenario, BTC could retest the $63,400 support.
Bitcoin Price Prediction for Today — August 13, 2026
Bitcoin is currently trading around $63,536, close to the $63,400 support and below the $64,300 resistance.The key levels for today are:
| Level | Importance |
|---|---|
| $65,200–$65,400 | Major resistance |
| $64,300 | Key resistance |
| $64,135 | Upper Bollinger Band |
| $63,574 | Middle Bollinger Band |
| $63,536 | Current price |
| $63,400 | Immediate support |
| $63,012 | Lower Bollinger Band |
| $62,500 | Major support |
Bullish Scenario
If Bitcoin continues to hold above $63,400 and breaks above $64,300, the short-term structure could improve.The potential upside path would be: $63,400 → $64,300 → $65,200–$65,400
The first important confirmation would be a sustained breakout above $64,300. A move above $64,300 with RSI above 50 would provide stronger momentum confirmation.
Bearish Scenario
If Bitcoin loses $63,400 on a sustained basis, sellers could regain control.The next technical area would be around $63,012, which is close to the lower Bollinger Band.If selling pressure continues below this area, $62,500 becomes the next major support.The bearish path would therefore be: $63,400 breakdown → $63,012 → $62,500
Sideways Scenario
Bitcoin could continue moving between $63,400 and $64,300 if buyers and sellers remain balanced.In this situation, the market may remain range-bound until the PPI release and Federal Reserve commentary create a stronger catalyst.
Bitcoin Price Prediction for Tomorrow — August 14, 2026
Tomorrow’s main U.S. events will focus on consumer spending, consumer sentiment and business inventories.
The most important event is U.S. Retail Sales at 8:30 AM ET, followed by the preliminary University of Michigan Consumer Sentiment report at 10:00 AM ET. Business Inventories are also scheduled for 10:00 AM ET.
| Event | Time ET | Time IST | Previous | BTC Impact |
|---|---|---|---|---|
| U.S. Retail Sales MoM | 8:30 AM | 6:00 PM | 0.2% | High |
| Retail Sales Control Group MoM | 8:30 AM | 6:00 PM | 0.5% | Moderate |
| Retail Sales Ex Autos MoM | 8:30 AM | 6:00 PM | -0.2% | Moderate |
| Michigan Consumer Sentiment | 10:00 AM | 7:30 PM | — | Moderate |
| Business Inventories MoM | 10:00 AM | 7:30 PM | 0.3% | Low to Moderate |
Bullish Scenario for August 14
If Bitcoin breaks above $64,300 today and holds that level, BTC could enter tomorrow with stronger short-term momentum.In that situation, the $65,200–$65,400 resistance zone would become the next major area to watch.
A weaker-than-expected Retail Sales number could increase concerns about economic growth and potentially support expectations for easier monetary policy, depending on the broader market reaction.
Bearish Scenario for August 14
If BTC breaks below $63,400 today and remains below the level, the bearish structure could continue into tomorrow.The next major support would be $62,500.
Strong Retail Sales data could indicate resilient consumer spending and potentially support the U.S. Dollar and Treasury yields. Depending on the market’s interpretation, that could create pressure on Bitcoin.
Bitcoin Price Target for Today and Tomorrow
| Scenario | Key Level | Possible Target/Area |
|---|---|---|
| Bullish | Above $64,300 | $65,200–$65,400 |
| Strong Bullish | Above $65,400 | Higher levels after confirmation |
| Sideways | $63,400–$64,300 | Consolidation |
| Bearish | Below $63,400 | $63,012 |
| Strong Bearish | Below $63,012 | $62,500 |
These are technical scenarios based on the attached chart and are not guaranteed price targets.
What Traders Should Watch
The most important technical level today is $64,300 on the upside and $63,400 on the downside.If BTC breaks $64,300 and RSI moves above 50, the short-term bullish setup would become stronger.If BTC remains below $64,300 and RSI stays below 50, Bitcoin could continue consolidating.A sustained break below $63,400 would shift the short-term structure toward the bearish side.The PPI release at 6:00 PM IST is likely to be the biggest scheduled volatility catalyst today.
Final Summary
Bitcoin is trading around $63,536, with $63,400 acting as the key immediate support and $64,300 acting as the first major resistance.A sustained move above $64,300 could open the way toward the $65,200–$65,400 resistance zone.
A sustained break below $63,400 could bring $63,012 and then $62,500 into focus.The 1-hour RSI is 48.34, while Bitcoin is slightly below the middle Bollinger Band at $63,574.Today’s most important event is the U.S. PPI at 6:00 PM IST, followed by Initial Jobless Claims and Federal Reserve speakers.
Tomorrow’s main events are U.S. Retail Sales at 6:00 PM IST and University of Michigan Consumer Sentiment at 7:30 PM IST. Business Inventories is also scheduled at 7:30 PM IST.Current short-term bias: Neutral to Slightly Bearish.
Frequently Asked Questions
What is the Bitcoin price today?
Bitcoin is trading around $63,536 according to the attached 1-hour chart.
What is the immediate Bitcoin support?
The immediate support is around $63,400.
What is the next major Bitcoin support?
The next major support shown on the chart is around $62,500.
What is Bitcoin’s immediate resistance?
The first major resistance is around $64,300.
What is Bitcoin’s major resistance?
The major resistance zone is $65,200–$65,400.
What is the current Bitcoin RSI?
The 1-hour RSI is 48.34.
What is the major U.S. economic event today?
The U.S. PPI report is scheduled for 8:30 AM ET, or approximately 6:00 PM IST.
What are the major U.S. economic events tomorrow?
The main events are U.S. Retail Sales at approximately 6:00 PM IST and University of Michigan Consumer Sentiment at 7:30 PM IST. Business Inventories is also scheduled at 7:30 PM IST.
Disclaimer
This article is for educational and informational purposes only. The technical analysis, support and resistance levels, price scenarios and market commentary are not financial advice and should not be considered a buy or sell recommendation. Cryptocurrency markets are highly volatile, and actual price movements can differ significantly from the scenarios discussed above.