

Bitcoin Price Prediction For Today and Tomorrow 10-11 August 2026- Bitcoin (BTC) is currently trading around $65,011 on the 1-hour chart. After recovering from the $64,000 area, Bitcoin has moved back toward the $65,000 level. However, the price is currently facing resistance around $65,200–$65,300, while the immediate support zone is located around $64,800–$64,900.
The current 1-hour RSI is approximately 50.76, which indicates neutral momentum. This means neither buyers nor sellers currently have a clear advantage. Because of this, the next major move could depend on whether Bitcoin breaks above the resistance zone or falls below the immediate support level.
For today and tomorrow, the $65,300 resistance and $64,800 support are the two most important levels to watch. A breakout above resistance could open the way toward $65,600 and $66,000, while a breakdown below support could bring $64,100 and $64,000 into focus.

Note: The levels and targets discussed in this article are chart-based possible scenarios and should not be considered guaranteed predictions.
Table of Contents
ToggleBitcoin Price Today
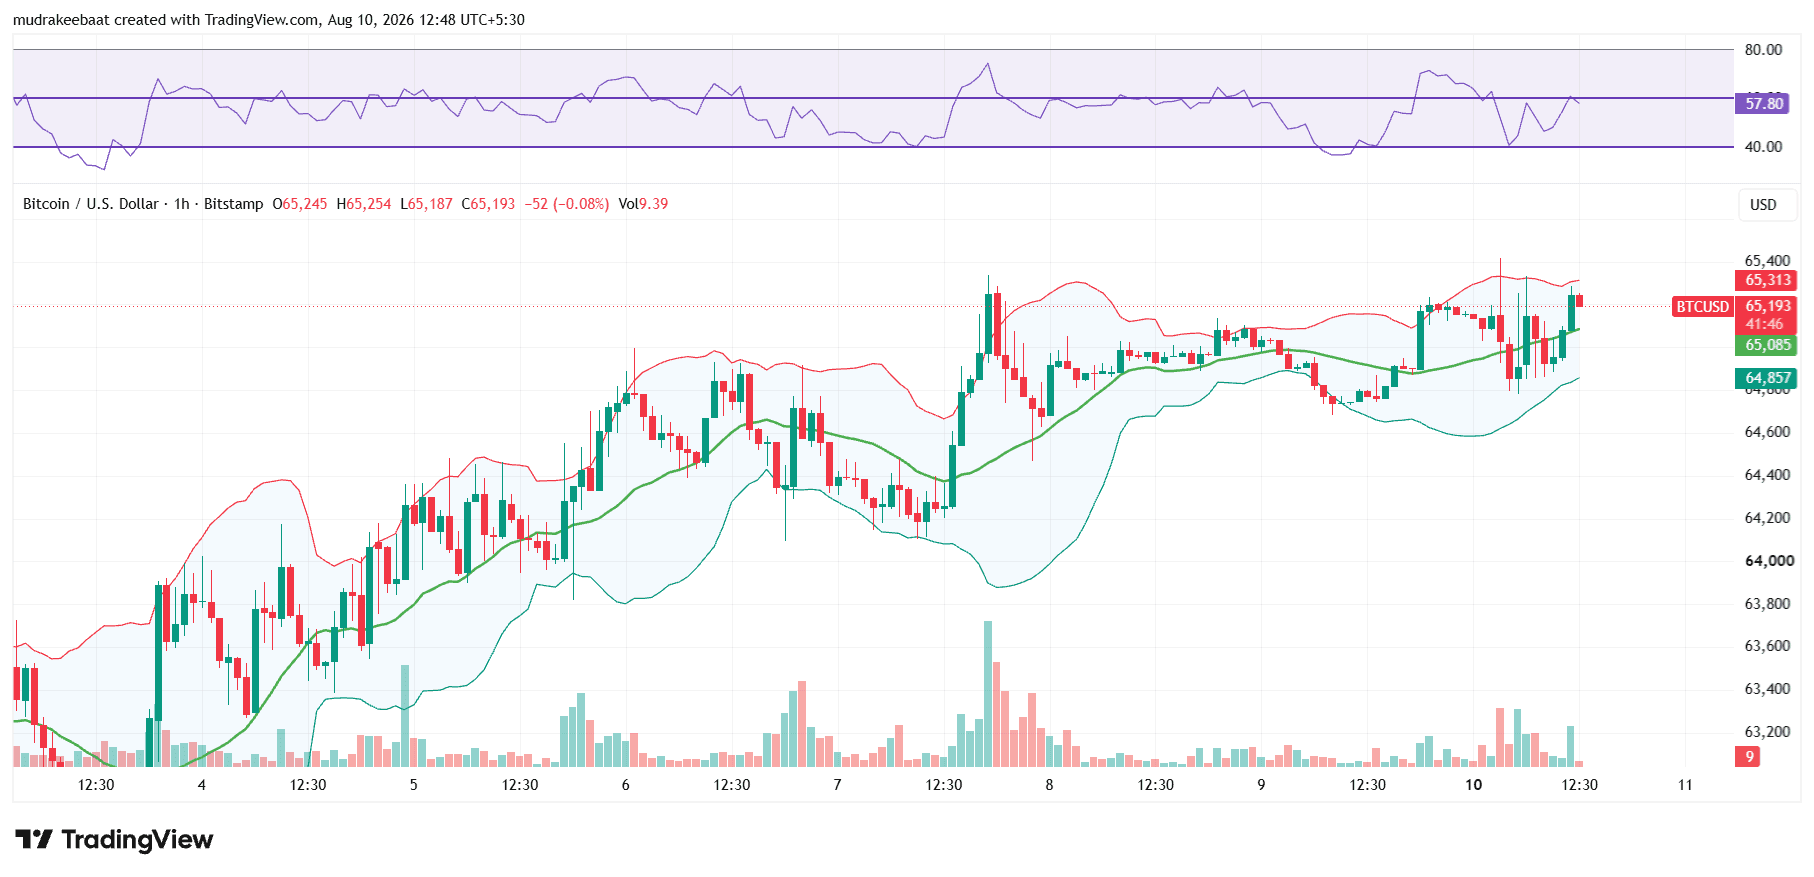
The following levels are important for today’s and tomorrow’s analysis & bitcoin current price Link
| Parameter | Level |
|---|---|
| Current BTC Price | $65,011 |
| RSI | 50.76 |
| Immediate Resistance | $65,200–$65,300 |
| Next Resistance | $65,600 |
| Major Resistance | $66,000–$66,300 |
| Immediate Support | $64,800–$64,900 |
| Second Support | $64,050–$64,150 |
| Major Support | Around $64,000 |
Bitcoin has recently recovered from the $64,000 region and moved toward $65,000. However, selling pressure is visible around the $65,200–$65,300 area, making this an important decision zone for the next trading session.
Bitcoin Technical Analysis
BTC Short-Term Trend
The 1-hour chart shows a recovery structure developing after Bitcoin found buying interest around the $64,000–$64,200 region.The price has moved higher from these lower levels, suggesting that buyers are still active. However, Bitcoin has repeatedly faced resistance near $65,200–$65,300.As a result, BTC is currently trading within a relatively narrow range.
Current Market Structure
- Buyers are active around: $64,800
- Sellers are active around: $65,200–$65,300
- Current price: Around $65,011
- Important breakout level: $65,300
- Important breakdown level: $64,800
Bitcoin RSI Analysis
RSI – 50.76
The 1-hour RSI is currently around 50.76.This indicates a neutral market condition. Bitcoin is not currently in an overbought or oversold zone.
| RSI Level | Market Momentum |
|---|---|
| Below 30 | Oversold |
| 30–40 | Weak |
| 40–50 | Neutral to Weak |
| 50–60 | Neutral to Positive |
| 60–70 | Strong |
| Above 70 | Overbought |
An RSI of 50.76 suggests that buyers and sellers are currently relatively balanced.
What to Watch Next
- If RSI moves toward 55–60, bullish momentum could strengthen.
- If RSI falls below 50, short-term weakness could increase.
- A move toward 45 or below could indicate stronger selling pressure.
Therefore, RSI should be monitored together with Bitcoin’s key support and resistance levels.
Bitcoin Resistance Levels
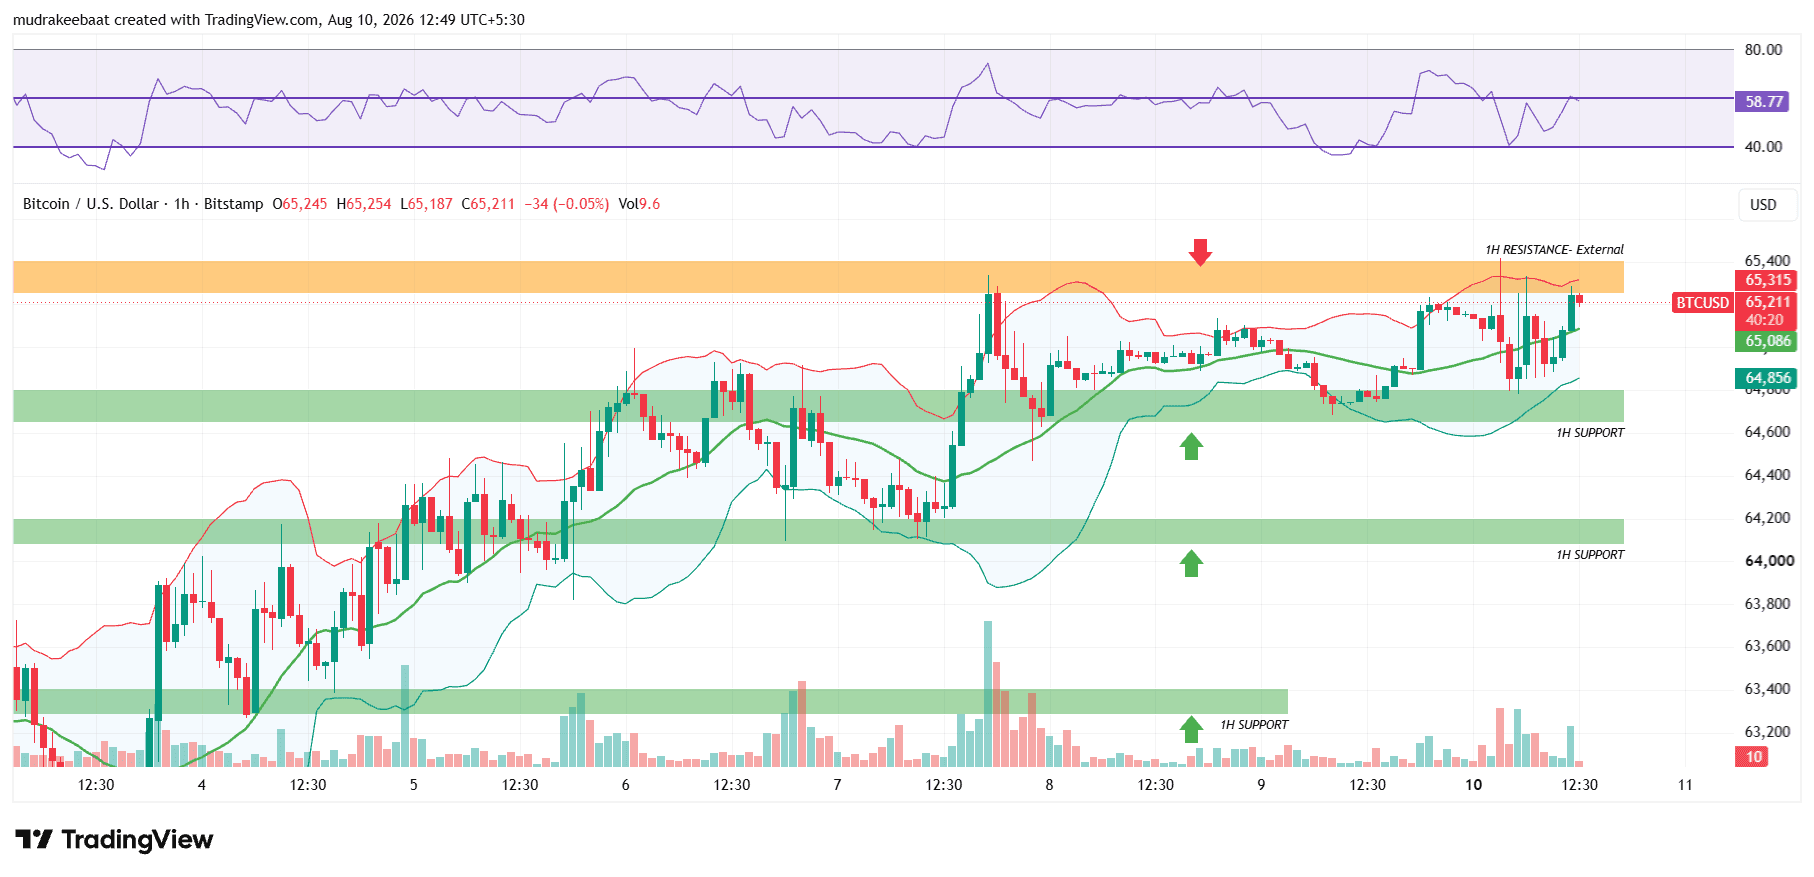
$65,200–$65,300 – Immediate Resistance
The $65,200–$65,300 zone is currently the most important immediate resistance area.Bitcoin has been facing selling pressure around this region. If BTC gets rejected again, short-term profit-taking could push the price toward lower support levels.
However, a strong candle close above $65,300, especially with increasing trading volume, could provide stronger confirmation of a bullish breakout.
Why $65,300 Is Important
- It is the immediate resistance zone.
- A breakout above this level could improve short-term momentum.
- Higher trading volume would make the breakout more meaningful.
- RSI moving toward 55–60 could provide additional momentum confirmation.
$65,600 – Next Resistance
If Bitcoin successfully breaks above $65,300, the next important level to monitor is $65,600.
This level could act as the first potential profit-taking or resistance zone after the breakout.
If BTC sustains above $65,600, attention could then shift toward the $66,000 area.
Bitcoin Major Resistance – $66,000–$66,300
The $66,000–$66,300 area represents the major resistance zone highlighted on the chart.The $66,000 level is important from both a technical and psychological perspective.if Bitcoin successfully crosses:
$65,300 → $65,600 → $66,000
then the $66,000–$66,300 area could become the next major decision zone.A strong rejection around $66,000 could lead to profit-taking and a pullback.
Bitcoin Support Levels
$64,800–$64,900 – Immediate Support
The $64,800–$64,900 zone is the immediate support area.Since Bitcoin is currently trading close to $65,000, this support is particularly important for the short-term structure.If BTC remains above this zone, buyers could continue to maintain short-term control.A bounce from this support could send Bitcoin back toward the $65,200–$65,300 resistance area.
$64,050–$64,150 – Second Support
If Bitcoin breaks below the $64,800 support, the next important support zone is around $64,050–$64,150.This area has previously shown buying activity.Therefore, if BTC moves below $64,800, the reaction around $64,100 will become important to monitor.
Bitcoin Price Prediction For Today
For today’s session, Bitcoin is likely to remain sensitive to the $64,800–$65,300 range.The short-term scenarios can be summarized as follows:
| BTC Price Movement | Possible Interpretation |
|---|---|
| Above $65,300 | Bullish breakout |
| $65,300–$65,600 | Upside momentum |
| Around $65,600 | Next resistance |
| $64,800–$65,300 | Consolidation |
| Below $64,800 | Bearish weakness |
| Around $64,100 | Next support |
| Below $64,000 | Stronger bearish structure |
If Bitcoin remains between $64,800 and $65,300, the market could continue consolidating.A decisive move outside this range could provide a clearer short-term direction.
Bitcoin Price Prediction For Tomorrow – August 11, 2026
Based on the current 1-hour chart, the following levels are important for tomorrow:
| Scenario | Possible Level |
|---|---|
| Current Price | $65,011 |
| Immediate Resistance | $65,200–$65,300 |
| Bullish Target 1 | $65,600 |
| Bullish Target 2 | $66,000 |
| Major Resistance | $66,000–$66,300 |
| Immediate Support | $64,800–$64,900 |
| Support 2 | $64,050–$64,150 |
| Major Support | Around $64,000 |
The key point for tomorrow will be whether BTC can break above $65,300 or falls below $64,800.
Bullish Scenario – Bitcoin Tomorrow
If Bitcoin breaks above $65,300 and sustains above this level, short-term bullish momentum could strengthen.The potential upside path could be:
$65,000 → $65,300 → $65,600 → $66,000
Bullish Confirmation Signals
- Price breaks above $65,300.
- A candle closes above the breakout level.
- Trading volume increases.
- RSI moves toward 55–60.
- BTC sustains above $65,600.
- Bitcoin tests or breaks the $66,000 resistance.
If these conditions occur, $65,600 and $66,000 could become the key upside levels to monitor.
Bearish Scenario – Bitcoin Tomorrow
If Bitcoin fails to break the $65,200–$65,300 resistance zone and selling pressure increases, BTC could move toward the immediate support at $64,800–$64,900.If $64,800 breaks and Bitcoin sustains below it, the next important zone could be $64,050–$64,150.The potential downside path could be:
$65,000 → $64,800 → $64,100 → $64,000
Bearish Confirmation Signals
- $64,800 support breaks.
- BTC sustains below $64,800.
- RSI falls below 50.
- Selling volume increases.
- $64,100 support fails.
- Bitcoin sustains below $64,000.
If these conditions develop, the short-term bullish structure could weaken.
Sideways Scenario – Bitcoin
A sideways scenario should also be considered because the current RSI is 50.76, indicating neutral momentum.If Bitcoin remains between $64,800 and $65,300, consolidation could continue.
Key Range Levels
Above $65,300: Bullish breakout
$64,800–$65,300: Sideways / consolidation
Below $64,800: Bearish breakdown
Until Bitcoin moves decisively outside this range, the market may continue to trade sideways.
When Will Bitcoin Turn Bullish?
Bitcoin’s short-term setup could become more bullish if the following conditions develop:
- $65,300 resistance breaks.
- Price closes above $65,300.
- Trading volume increases.
- RSI moves toward 55–60.
- BTC sustains above $65,600.
- The $66,000 resistance is successfully tested or broken.
If these conditions occur, $65,600 and $66,000 could become the important upside levels.
When Will Bitcoin Turn Bearish?
Short-term weakness could become stronger if:
- $64,800 support breaks.
- BTC remains below $64,800.
- RSI falls below 50.
- Selling volume increases.
- $64,100 support fails.
- Bitcoin experiences a sustained breakdown below $64,000.
Such a setup could weaken the current short-term bullish structure.
Bitcoin Price Target – Final View
Overall, the Bitcoin 1-hour chart currently shows a neutral to mildly bullish setup.Bitcoin is trading around $65,011, while the RSI is at 50.76. This suggests that the market currently lacks strong directional momentum.For today and tomorrow, the two most important levels are:
Bullish Trigger: $65,300
A sustained breakout above $65,300 could open the way toward:
$65,600 → $66,000 → $66,300
Bearish Trigger: $64,800
A sustained breakdown below $64,800 could bring:
$64,100 → $64,000
into focus.
Therefore, the $64,800–$65,300 range remains the key short-term trading zone to watch.
Bitcoin Price Prediction For Today and Tomorrow – Quick Summary
| Parameter | Level |
|---|---|
| Current BTC Price | $65,011 |
| RSI | 50.76 |
| Immediate Resistance | $65,200–$65,300 |
| Bullish Target 1 | $65,600 |
| Bullish Target 2 | $66,000 |
| Major Resistance | $66,000–$66,300 |
| Immediate Support | $64,800–$64,900 |
| Support 2 | $64,050–$64,150 |
| Major Support | $64,000 |
Bitcoin Top News Today and Yesterday
Bitcoin’s price is not being driven by technical levels alone. Recent developments around Bitcoin’s network, U.S. crypto regulation, macroeconomic conditions and institutional activity are also important factors to watch.Here are some of the key Bitcoin and crypto headlines from August 9 and August 10, 2026.
1. Bitcoin Remains Near the $65,000 Level
Bitcoin entered the new week trading around the $65,000 area, with the market remaining in a broader consolidation phase. Recent market commentary suggests that BTC has struggled to generate a decisive bullish move, keeping traders focused on important support and resistance levels.This is consistent with the technical setup in our chart, where $65,300 is the key immediate resistance and $64,800 is the important support level.
2. Bitcoin BIP-110 Fork Developments Remain in Focus
One of the major Bitcoin-related stories around August 9 was the development surrounding BIP-110, a proposed Bitcoin soft fork focused on restricting certain large data fields in transactions.
Earlier estimates placed the mandatory signaling window around August 9, 2026, with the proposal mainly targeting data-heavy uses such as Ordinals-style inscriptions and large OP_RETURN payloads.
The development attracted attention because of the potential impact on Bitcoin’s transaction-data rules and the differing positions among miners and Bitcoin ecosystem participants.
For BTC traders, the important point is that this is primarily a Bitcoin network and infrastructure story, rather than a direct price catalyst. However, unexpected developments around a proposed fork can temporarily increase market uncertainty.
3. Bitcoin Anti-Spam Fork Debate Adds Network Uncertainty
Market updates from August 9 also highlighted developments around a Bitcoin anti-spam fork, with reports that a minority chain associated with the proposal halted after mining two blocks.
The immediate market reaction appeared relatively contained, with Bitcoin remaining close to the $64,800 area rather than experiencing a major price dislocation.
This is worth monitoring because prolonged disagreement over Bitcoin network rules can increase short-term uncertainty, particularly if the situation develops into a larger chain or mining-related dispute.
4. U.S. Crypto Regulation Remains an Important Market Theme
The CLARITY Act remains one of the major regulatory stories for the crypto market.Recent reports indicate that the legislation is moving toward a September Senate process/vote, rather than an August 10 final deadline. The bill is important because it seeks to establish a clearer regulatory framework for digital assets in the United States.
For Bitcoin, clearer U.S. crypto regulation could potentially improve the long-term institutional environment, although the timing and final outcome remain uncertain.
5. U.S. Inflation Data Is a Major Event This Week
Another important factor for Bitcoin traders is the upcoming U.S. inflation data.Market commentary for the week of August 10–16 identifies the July U.S. Consumer Price Index (CPI) report as one of the major potential market-moving events, with additional economic data scheduled later in the week.
Why does this matter for Bitcoin?Because U.S. inflation data can influence expectations around Federal Reserve monetary policy, interest rates and the U.S. dollar.In simple terms:
Lower-than-expected inflation → potentially supportive for risk assets
Higher-than-expected inflation → potentially negative for risk assets
Bitcoin can react quickly when major U.S. macroeconomic data changes interest-rate expectations.
6. Bitcoin Liquidity Levels Are Being Closely Watched
Current market data is also showing important liquidity zones around Bitcoin.One August 10 market update highlighted notable liquidation pressure below approximately $64,500, while a concentration of short liquidations was identified around $65,800–$66,000.
This is particularly interesting when compared with our technical chart.
| Bitcoin Level | Importance |
|---|---|
| $64,000 | Major support |
| $64,500 | Important liquidity area |
| $64,800–$64,900 | Immediate support |
| $65,200–$65,300 | Immediate resistance |
| $65,600 | Next resistance |
| $65,800–$66,000 | Important liquidity zone |
| $66,000–$66,300 | Major resistance |
This means a strong move through $65,800–$66,000 could potentially trigger short covering, while a breakdown toward the lower liquidity zone could increase downside volatility.
How Today’s Bitcoin News Could Affect BTC
The current news flow is mixed rather than clearly bullish or bearish.
Potentially Positive Factors
- Bitcoin continues to hold around the $65,000 region.
- Lower U.S. yields could provide some support to risk assets.
- Progress toward clearer U.S. crypto regulation could be positive over the longer term.
- A sustained move above $65,300 could improve short-term momentum.
Potentially Negative Factors
- Bitcoin remains trapped in a broader consolidation structure.
- BIP-110 and related Bitcoin network developments can create short-term uncertainty.
- U.S. inflation data could increase volatility.
- A breakdown below $64,800 could bring lower support levels into focus.
Recent market commentary also describes BTC as remaining in a consolidation structure, which fits the technical picture from the chart you provided.
Bitcoin News + Technical Analysis: What Traders Should Watch
Combining the latest headlines with the chart gives us a simple roadmap:
| Event / Level | What to Watch |
|---|---|
| Above $65,300 | Bullish breakout possibility |
| $65,600 | Next resistance |
| $65,800–$66,000 | Short-liquidation/liquidity area |
| $66,000–$66,300 | Major resistance |
| $64,800 | Key support |
| $64,500 | Important liquidity area |
| $64,100 | Second support |
| $64,000 | Major support |
| U.S. CPI | Potential volatility catalyst |
| CLARITY Act | Regulatory sentiment |
| BIP-110 | Bitcoin network/fork developments |
Overall News Sentiment
Short term: Neutral
Technical setup: Neutral to Mildly Bullish
Major bullish trigger: $65,300
Major bearish trigger: $64,800
Frequently Asked Questions About Bitcoin Price Prediction
What is the Bitcoin price today?
According to the provided 1-hour chart, Bitcoin is trading around $65,011.
What is the Bitcoin price target for tomorrow?
If BTC breaks above $65,300, the next potential levels are $65,600 and $66,000.
What is the major resistance for Bitcoin?
The major resistance zone is around $66,000–$66,300.
What is the immediate support for Bitcoin?
The immediate support zone is $64,800–$64,900.
What happens if Bitcoin breaks below $64,800?
A sustained breakdown below $64,800 could bring $64,100 and then $64,000 into focus.
Is Bitcoin bullish or bearish right now?
Based on the provided 1-hour chart, the setup is neutral to mildly bullish, with $65,300 acting as the key bullish breakout level.
Disclaimer
This Bitcoin analysis is provided for educational and informational purposes only. The support levels, resistance levels, and price targets mentioned in this article represent chart-based possible scenarios and are not guaranteed predictions or financial advice. Cryptocurrency markets are highly volatile, and actual price movements can change rapidly depending on market sentiment, news, liquidity, Bitcoin dominance, and broader global market conditions. Always conduct your own research and consider your risk tolerance before making any trading or investment decision.