Introduction
Is article me hum Meesho Technical Analysis for Intraday Feb 9, 2026 ko simple price action ke through samjhenge. Aaj trading session me meesho share ₹153 par close hua. Daily chart me price ne upar move dikhaya, lekin higher levels par strong selling pressure aane se long upper wick bani, jo resistance ke paas weakness ka signal deti hai. Closing mid-range ke paas hui, jo market me thodi uncertainty dikhati hai—ab dekhna hoga Monday ko price ka behaviour kaisa rehta hai.
Sabse Pahle-
Ek Intraday Traders Ko 15 Minutes Me Kya Dekhna Chahiye?
Recent Trend & Price Action-
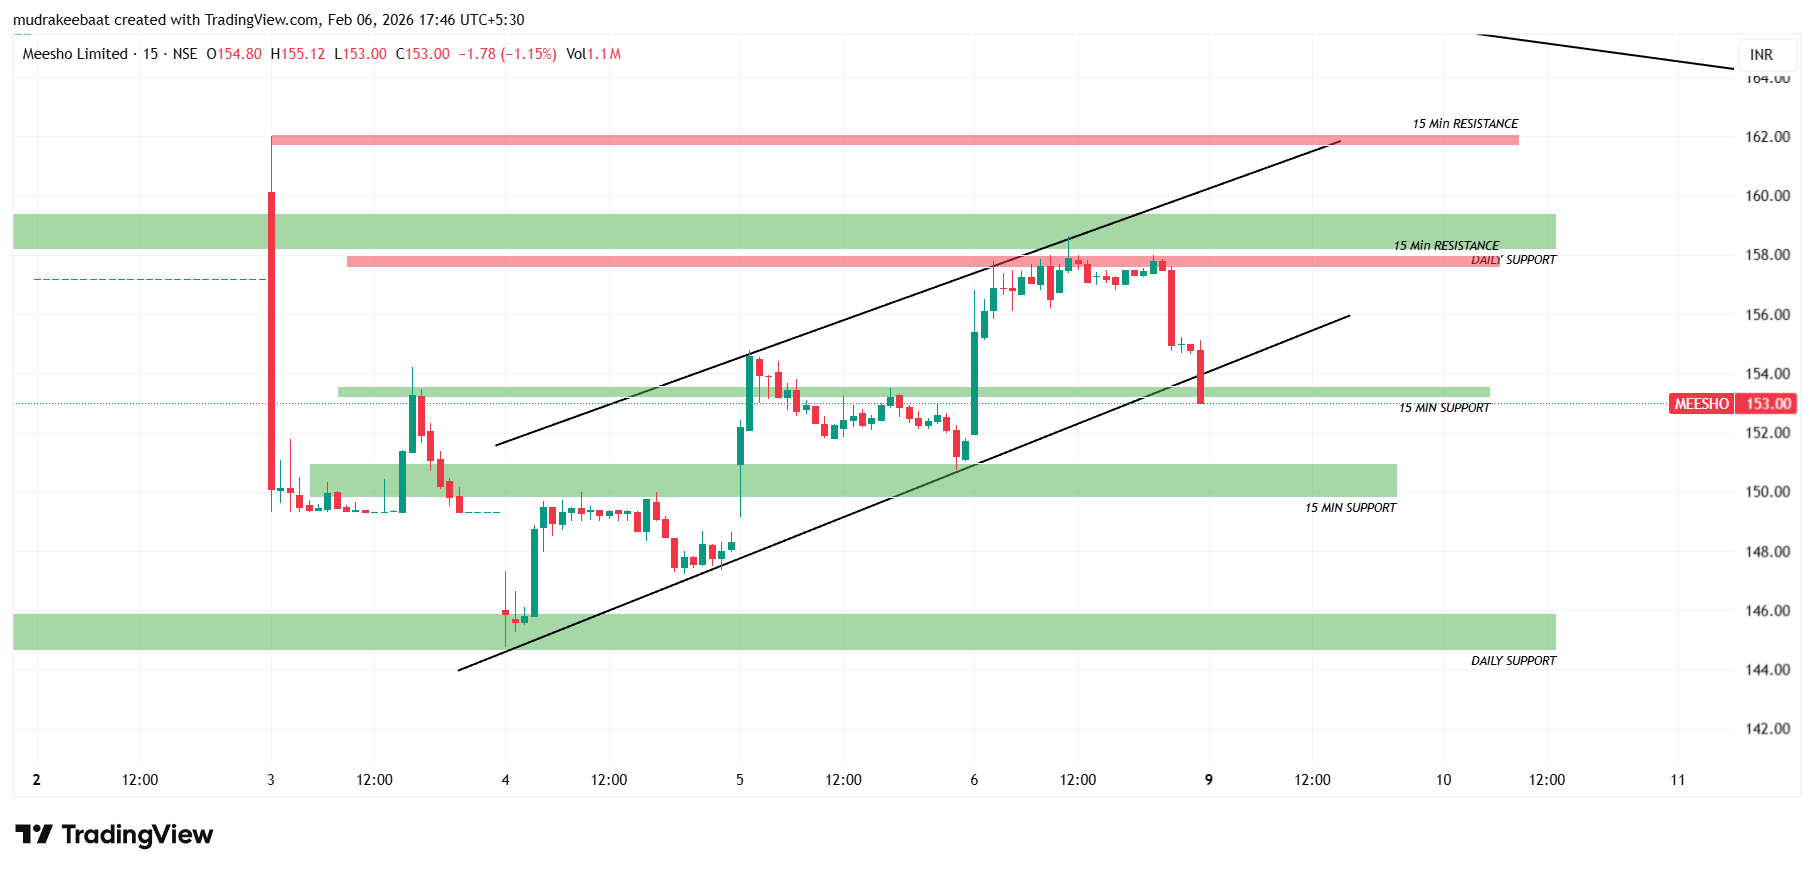
- Ek intraday trader ko sabse pahle 15 minutes ka trend dekhna chahiye, agar main 15 minutes me dekhu to mujhe trend uptrend me nazar aa raha jisme higher-high ka formation hua.
- Is time frame mein clear dikh raha hai ki buyers strong hain, kyunki price ek clean uptrend follow kar raha hai.
- Price ek proper rising channel ko follow karte hue upar move kar raha hai.
Meesho Technical Analysis for Intraday Feb 9, 2026 – Important Support & Resistance Level For Tomorrow ( 15 Minutes Time Frame )
Next trading session me ye point me dhyan rakhna chahiye agar aap trade karne ko soch rahe ho.
| Zone Type | Price Area ( Approx ) |
| Support Zone 1 | ₹153 |
| Support Zone 2 | ₹150 |
| Support Zone 3 | ₹145 |
| Resistance Zone 1 | ₹158 |
| Resistance Zone 2 | ₹162 |
Download Image- TradingView
Intraday Trading Strategy for Tomorrow In 15 Minutes (Purely Technical, Not Advice)
Scenario 1: Support ke paas reaction
Price abhi 15-min support zone ke aas-paas hai. Agar yahan price slow ho jata hai aur chhoti candles banne lagti hain, to iska matlab buyers yahan defend karne ki koshish kar rahe hain.
Scenario 2: Support ke niche pressure
Agar 15-minute candle support ke niche close dene lagti hai, to ye signal hoga ki selling pressure abhi dominant hai aur price next lower zone ki taraf move kar sakta hai.
Scenario 3: Pullback ke baad range move
Agar price support se thoda bounce kare lekin upar jaakar fir se reject ho, to market range-bound reh sakti hai — na clear strength, na clear weakness. Overall, 15-minute chart par abhi decision zone chal raha hai. Intraday trader ke liye sabse important hoga price ka reaction dekhna, direction assume karna nahi.
Ek Intraday Traders Ko 5 Minutes Me Kya Dekhna Chahiye?
Recent Trend & Price Action-
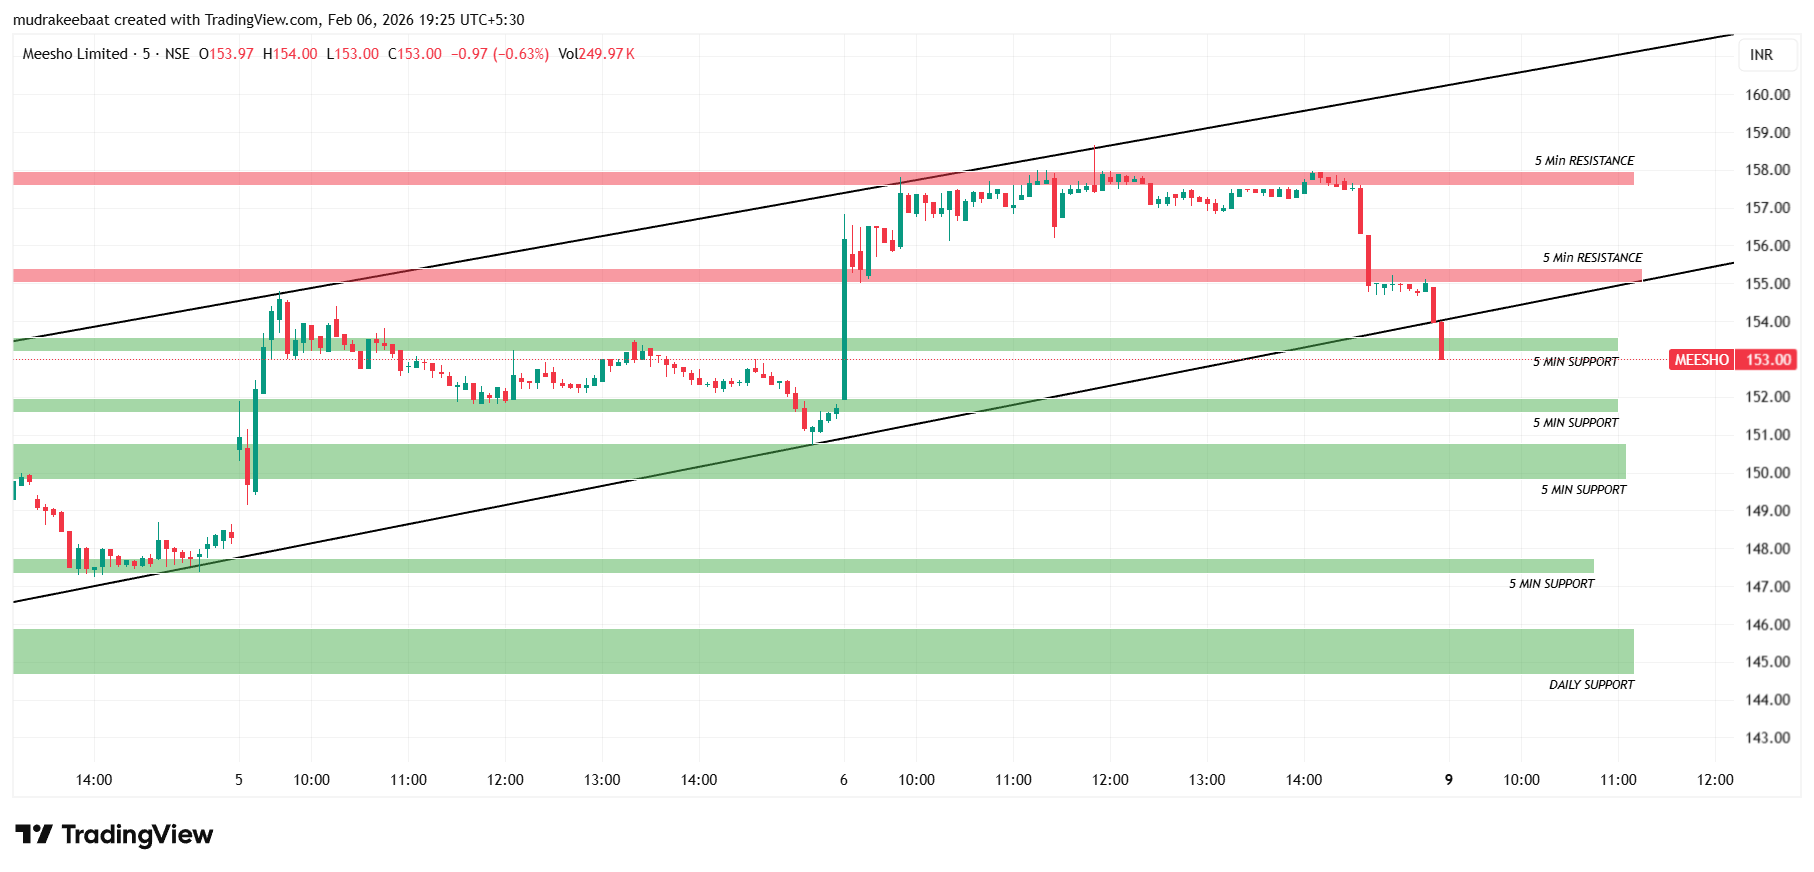
- Shuruat me price ne strong bounce kiya aur higher highs & higher lows bnaya hai jisme short term bullish structure ho sakta hai.
- Jab Price beech me pauch gya to strong green impulsive move hua jo buyers ka control confirm show ho raha.
Meesho Technical Analysis for Intraday Feb 9, 2026 – Important Support & Resistance Level For Tomorrow ( 5 Minutes Time Frame )
| Zone Type | Price Area ( Approx ) |
| Support Zone 1 | ₹153 |
| Support Zone 2 | ₹150 |
| Support Zone 3 | ₹147 |
| Resistance Zone 1 | ₹155 |
| Resistance Zone 2 | ₹158 |
Download Image- TradingView
Intraday Trading Strategy for Tomorrow In 15 Minutes (Purely Technical, Not Advice)
Scenario 1: Support ke paas stability
Price abhi 5-min support zone ke around hai. Agar yahan small candles aur slow movement dikhta hai, to iska matlab ho sakta hai ki market balance banane ki koshish kar rahi hai.
Scenario 2: Support ke niche weakness
Agar 5-minute candle support ke niche close dene lagti hai, to short-term me selling pressure extend ho sakta hai aur price lower support ki taraf move kar sakta hai.
Scenario 3: Pullback aur range
Agar price support se bounce kare lekin upar 5-min resistance ke paas fir se reject ho, to market range-bound reh sakti hai, jahan clear direction nahi milta.
Overall, 5-minute chart batata hai ki market abhi reaction mode me hai. Kal intraday me sabse important hoga support–resistance par price ka behaviour, na ki fast assumptions.
Summary-
Monday Trading Setup (Only Analysis)
- Bullish Case: Agar ₹158 ke above ek bullish candle ke sath close kare.
-
Bearish Case: Agar ₹150 ke niche jaye tab hum shayad predicite kar sakte hai ye niche jayega.
Yeh sirf probability-based observation hai, koi buy/sell advice nahi.
Agar aap Meesho share ke bare me aur detail me padhna chahte hain, to yahan study kar sakte hain:
Meesho Share Detailed Study Link
Disclaimer
Yeh analysis sirf educational aur informational purpose ke liye hai. Main SEBI registered advisor nahi hoon. Stock market mein risk hota hai aur past price behaviour future results ki guarantee nahi deta. Koi bhi decision lene se pehle apne financial advisor se salah lena zaruri hai. Yeh content beginner education ke liye banaya gaya hai.